
“If it [a scientific hypothesis] disagrees with experiment, it’s WRONG.” – Nobel Prize winner Richard Feynman
Latest Computer Climate Models Run Almost as Hot as Before
The narrative that global warming is largely human-caused and that we need to take drastic action to control it hinges entirely on computer climate models. It’s the models that forecast an unbearably hot future unless we rein in our emissions of CO2.
But the models have a dismal track record. Apart from failing to predict a recent slowdown in global warming in the early 2000s, climate models are known even by modelers to consistently run hot. The previous generation of models, known in the jargon as CMIP5 (Coupled Model Intercomparison Project Phase 5), overestimated short-term warming by more than 0.5 degrees Celsius (0.9 degrees Fahrenheit) above observed temperatures. That’s 50% of all the global warming since preindustrial times.
The new CMIP6 models aren’t much better. The following two figures reveal just how much both CMIP5 and CMIP6 models exaggerate predicted temperatures, and how little the model upgrade has done to shrink the difference between theory and observation. The figures were compiled by climate scientist John Christy, who is Director of the Earth System Science Center at the University of Alabama in Huntsville and an expert reviewer of the upcoming sixth IPCC (Intergovernmental Panel on Climate Change) report.
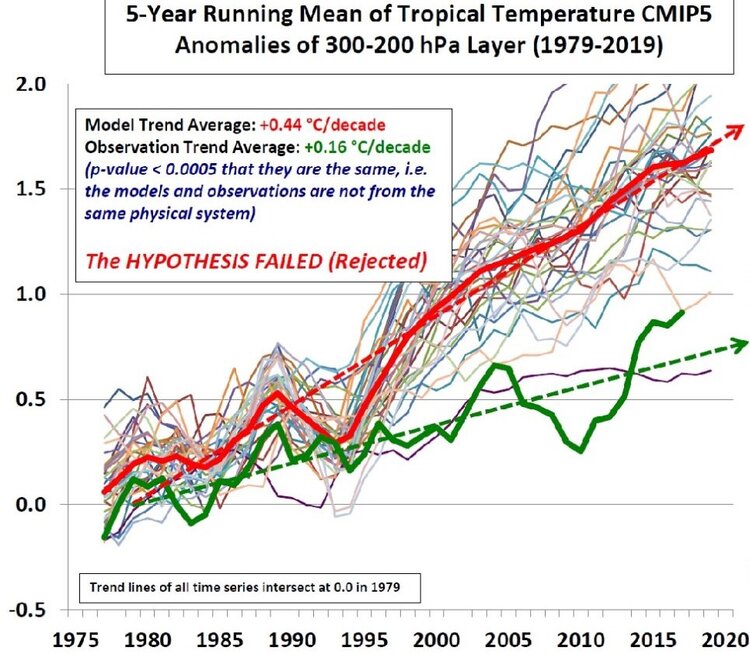
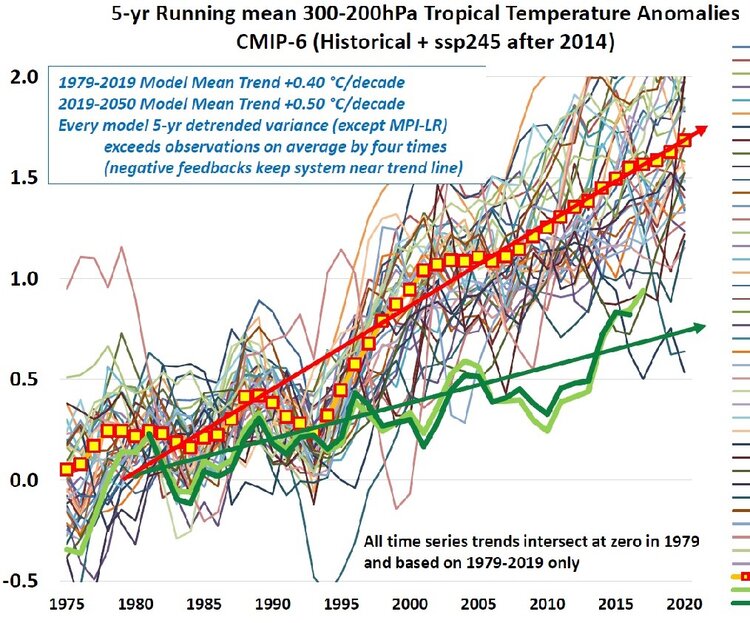
Both figures plot the warming relative to 1979 in degrees Celsius, measured in a band in the tropical upper atmosphere between altitudes of approximately 9 km (30,000 feet) and 12 km (40,000 feet). That’s a convenient band for comparison of model predictions with measurements made by weather balloons and satellites. The thin colored lines indicate the predicted variation of temperature with time for the different models, while the thick red and green lines show the mean trend in degrees Celsius of warming per decade for models and observations, respectively.
The trend for CMIP6 models is depicted more clearly in Christy’s next figure, which compares the warming rates for 39 of the models. The average CMIP6 trend in warming rate is 0.40 degrees Celsius (0.72 degrees Fahrenheit) per decade, compared with the actual observed rate of 0.17 degrees Celsius (0.31 degrees Fahrenheit) per decade – meaning 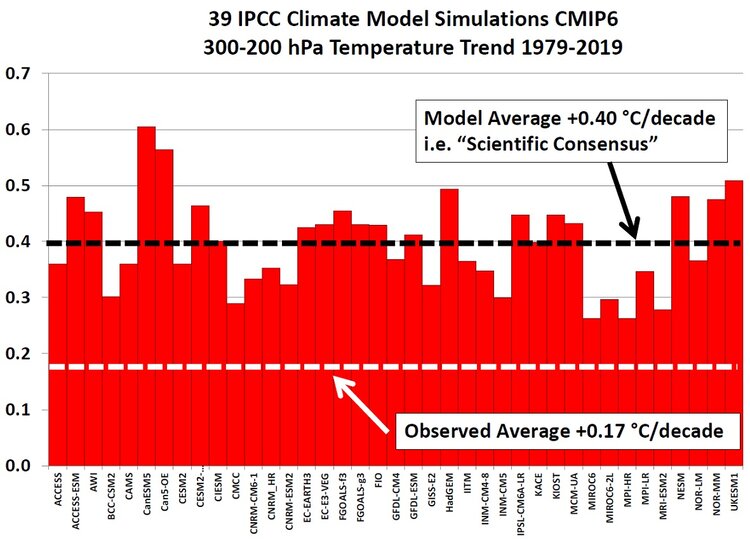
These CMIP6 numbers are only a marginal improvement over those predicted by the older CMIP5 models, for which the warming trend was 0.44 degrees Celsius (0.72 degrees Fahrenheit) per decade, or 2.75 times higher than the observed rate of 0.16 degrees Celsius (0.29 degrees Fahrenheit) per decade (for a slightly different set of measurements),
It’s seen that the warming rates for any particular model fluctuate wildly in both cases, much more so than the observations themselves. Christy says the large variability is a sign that the models underestimate negative feedbacks in the climate system, especially from clouds that I’ve discussed in another post. Negative feedback is stabilizing and acts to damp down processes that cause fluctuations. There is evidence, albeit controversial, that feedback from high clouds such as cirrus clouds – which normally warm the planet – may not be as strongly positive as the new models predict, and could even be negative overall.
You may be wondering why all these comparisons between models and observations are made high up in the atmosphere, rather than at the earth’s surface which is where we actually feel global warming. The reason is the atmosphere at 9 to 12 km (6 to 7 miles) above the tropics is a much more sensitive test of CO2 greenhouse warming than it is near the ground. Computer climate models predict that the warming rate at those altitudes should be about twice as large as at ground level, giving rise to the so-called CO2 “hot spot.”
The hot spot is illustrated in the figure below, showing the air temperature as a function of both altitude (measured as atmospheric pressure) and global latitude, as predicted by a Canadian model. Similar predictions come from the other CMIP6 models. The hot spot is the red patch at the center of the figure bounded by the 0.6 degrees Celsius (1.1 degrees Fahrenheit) contour, extending roughly 20o either side of the equator and at altitudes of 30,000-40,000 feet. The corresponding temperature on the ground is seen to be less than 0.3 degrees Celsius (0.5 degrees Fahrenheit).

But the hot spot doesn’t show up in measurements made by weather balloons or satellites. This mismatch between models and experiment is important because the 30,000-40,000 feet band in the atmosphere is the very altitude from which infrared heat is radiated away from the earth. The models run hot, according to Christy, because they trap too much heat that in reality is lost to outer space – a consequence of insufficient negative feedback in the models.
William:
Thank you for your extended comment. It’s an honor to hear from such a distinguished meteorologist.
However, I’m not sure I agree with your statement that “A characteristic of computer models is an erroneous increase in surface relative humidity as the models warm.”
While I’m not familiar with the Riehl and Malkus paper, it’s my understanding that warming increases the SPECIFIC humidity by raising the water vapor concentration in the atmosphere through evaporation. Because warming also increases the saturation level for water vapor, the relative humidity is affected too – but it’s not clear in which direction.
The 1979 Charney Report – the original basis for computer climate models – assumed that global warming doesn’t change the relative humidity in the troposphere at all. As you’ll know, relative humidity is closely tied to the strength of the water vapor feedback. If the relative humidity distribution in the troposphere does NOT remain constant as warming occurs, the water vapor feedback may be weaker than the models estimate.
But maybe that’s just another way of presenting your argument.
Like you, I’m a “lukewarmer” skeptic who accepts that global warming is real, but thinks the human contribution has been exaggerated.
Ralph Alexander
There are fundamental problems associated with both the popular explanation for the enhanced greenhouse effect, and the construct of computer models.
Greenhouse gases emit more radiation, both to space and back to the surface, than they absorb. Thus the GHG tend to cool the troposphere and generate convective instability. It is the back LW radiation at the surface that reduces surface energy loss (from LW radiation emission, heat conduction and evaporation of Latent energy). The surface temperature is an outcome of a balance between the gain of energy from absorbed solar radiation and LW radiation from the atmospheric GHG, and loss. Increasing the atmospheric GHG increases the surface energy gain from LW radiation emitted by GHG; the surface temperature rises to a new equilibrium.
There is a need for processes to distribute heat and latent energy exchanged from the surface through the atmosphere. That is, to offset the net atmospheric LW radiation loss and sustain a balanced system. The processes whereby convection does this distribution were explained by Herbert Riehl and Joanne Simpson (then Malkus) in a 1958 paper published in Geophysica.
An important finding of the paper is that while high energy boundary layer air is transported upwards in the buoyant hot towers there is also substantial transport of lower energy middle tropospheric air to the boundary layer. This latter cools and reduces the relative humidity of the boundary layer, thus enhancing heat and latent energy loss from the surface causing a lower equilibrium temperature.
A characteristic of computer models is an erroneous increase in surface relative humidity as the models warm. The surface temperature is enhanced because surface energy loss by evaporation is suppressed.
If the modelers read the Riehl and Malkus paper and incorporated more mass transport by downdraughts in their models they would find a significantly lower temperature response to rising CO2.
CO2 does cause global warming, just not as much as the models project.
William Kininmonth
Dave:
While I don’t find your comment snarky, I think you’re wrong when you say “up to date data might fit the models a little better.” Note that the observations here are of tropospheric, not surface temperatures. The satellite record for the troposphere, which you can find at https://www.drroyspencer.com/wp-content/uploads/UAH_LT_1979_thru_January_2021_v6.jpg, does indeed show the strong El Niño in 2016-2017 when the temperature spiked upward. But you can see that from 2018 to 2020, the temperature dropped and then came back again – so a net wash over that period. Therefore, the observational trend to 2017 is about the same all the way to 2020. The models are not good representations of the real world.
Also, the computer models never predicted imminent cooling. That idea was something I personally pushed in my first book, but it came from my mistaken read of the data at the time, not from any model.
Ralph
You may be interested in William Kininmonth’s explanation of why the models run hot, directly above this comment. He’s a retired meteorologist who headed Australia’s National Climate Centre for 12 years.
Ralph,
The temperature data in the plots terminates a few years before the model predictions. It is hard to read the time scale, but maybe the last year plotted was 2017. The three years since have been hotter. I think up to date data might fit the models a little better. In any case, the models seem better than the ones predicting, year after year since about 2010, that cooling is just around the corner. (Sorry to be snarky.)
Dave
I have a problem with the use of the term “climate models”.
These are computer games that make wrong predictions.
They represent the personal opinions of the people who own the models and program the computers.
The computer predicts what it is told to predict.
Real models make right predictions, and the predictions should get more accurate over time, as the models are refined.
The climate computer games were inaccurate to begin with, and have remained inaccurate for three decades. It would appear that accuracy is not important to the people who own the models.
My comments do not apply to the Russian INM model, which seems to make accurate predictions.
My own “model” is better. I have observed the warming trend since the 1970s, and just assume it will continue.
I love the mild warming since the 1970s here in Michigan USA, and I want more warming. Warming in Michigan, Alaska, Siberia etc. is not an existential crisis. The greatest warming since the 1970s has been in the coldest areas of the Northern Hemisphere, mainly in the six coldest months of the year, and mainly at night. You don’t get that information from a single global average temperature … a temperature that not one person actually lives in.
I just can’t get all excited by warmer winter nights in Siberia !
_______________________________________________________________________
William:
Thank you for your extended comment. It’s an honor to hear from such a distinguished meteorologist.
However, I’m not sure I agree with your statement that “A characteristic of computer models is an erroneous increase in surface relative humidity as the models warm.”
While I’m not familiar with the Riehl and Malkus paper, it’s my understanding that warming increases the SPECIFIC humidity by raising the water vapor concentration in the atmosphere through evaporation. Because warming also increases the saturation level for water vapor, the relative humidity is affected too – but it’s not clear in which direction.
The 1979 Charney Report – the original basis for computer climate models – assumed that global warming doesn’t change the relative humidity in the troposphere at all. As you’ll know, relative humidity is closely tied to the strength of the water vapor feedback. If the relative humidity distribution in the troposphere does NOT remain constant as warming occurs, the water vapor feedback may be weaker than the models estimate.
But maybe that’s just another way of presenting your argument.
Like you, I’m a “lukewarmer” skeptic who accepts that global warming is real, but thinks the human contribution has been exaggerated.
Ralph Alexa
There are fundamental problems associated with both the popular explanation for the enhanced greenhouse effect, and the construct of computer models.
Greenhouse gases emit more radiation, both to space and back to the surface, than they absorb. Thus the GHG tend to cool the troposphere and generate convective instability. It is the back LW radiation at the surface that reduces surface energy loss (from LW radiation emission, heat conduction and evaporation of Latent energy). The surface temperature is an outcome of a balance between the gain of energy from absorbed solar radiation and LW radiation from the atmospheric GHG, and loss. Increasing the atmospheric GHG increases the surface energy gain from LW radiation emitted by GHG; the surface temperature rises to a new equilibrium.
There is a need for processes to distribute heat and latent energy exchanged from the surface through the atmosphere. That is, to offset the net atmospheric LW radiation loss and sustain a balanced system. The processes whereby convection does this distribution were explained by Herbert Riehl and Joanne Simpson (then Malkus) in a 1958 paper published in Geophysica.
An important finding of the paper is that while high energy boundary layer air is transported upwards in the buoyant hot towers there is also substantial transport of lower energy middle tropospheric air to the boundary layer. This latter cools and reduces the relative humidity of the boundary layer, thus enhancing heat and latent energy loss from the surface causing a lower equilibrium temperature.
A characteristic of computer models is an erroneous increase in surface relative humidity as the models warm. The surface temperature is enhanced because surface energy loss by evaporation is suppressed.
If the modelers read the Riehl and Malkus paper and incorporated more mass transport by downdraughts in their models they would find a significantly lower temperature response to rising CO2.
CO2 does cause global warming, just not as much as the models project.
William Kininmonth
Dave:
While I don’t find your comment snarky, I think you’re wrong when you say “up to date data might fit the models a little better.” Note that the observations here are of tropospheric, not surface temperatures. The satellite record for the troposphere, which you can find at https://www.drroyspencer.com/wp-content/uploads/UAH_LT_1979_thru_January_2021_v6.jpg, does indeed show the strong El Niño in 2016-2017 when the temperature spiked upward. But you can see that from 2018 to 2020, the temperature dropped and then came back again – so a net wash over that period. Therefore, the observational trend to 2017 is about the same all the way to 2020. The models are not good representations of the real world.
Also, the computer models never predicted imminent cooling. That idea was something I personally pushed in my first book, but it came from my mistaken read of the data at the time, not from any model.
Ralph
You may be interested in William Kininmonth’s explanation of why the models run hot, directly above this comment. He’s a retired meteorologist who headed Australia’s National Climate Centre for 12 years.
Ralph,
The temperature data in the plots terminates a few years before the model predictions. It is hard to read the time scale, but maybe the last year plotted was 2017. The three years since have been hotter. I think up to date data might fit the models a little better. In any case, the models seem better than the ones predicting, year after year since about 2010, that cooling is just around the corner. (Sorry to be snarky.)
Dave
Richard Greene · 0 Likes
I have a problem with the use of the term “climate models”.
These are computer games that make wrong predictions.
They represent the personal opinions of the people who own the models and program the computers.
The computer predicts what it is told to predict.
Real models make right predictions, and the predictions should get more accurate over time, as the models are refined.
The climate computer games were inaccurate to begin with, and have remained inaccurate for three decades. It would appear that accuracy is not important to the people who own the models.
My comments do not apply to the Russian INM model, which seems to make accurate predictions.
My own “model” is better. I have observed the warming trend since the 1970s, and just assume it will continue.
I love the mild warming since the 1970s here in Michigan USA, and I want more warming. Warming in Michigan, Alaska, Siberia etc. is not an existential crisis. The greatest warming since the 1970s has been in the coldest areas of the Northern Hemisphere, mainly in the six coldest months of the year, and mainly at night. You don’t get that information from a single global average temperature … a temperature that not one person actually lives in.
I just can’t get all excited by warmer winter nights in Siberia !